Rotary Positive Displacement Blower Performance Curves
What are PD Blowers?
Rotary positive displacement blowers, a.k.a. PD blowers, are a constant volume device that employ lobe impellers (often times referred to as rotors) rotating in opposite directions within a blower housing closed at the ends by end plates and traps a certain volume of air or gas then discharges or forces it out against the system pressure.
Gas flows from high pressure to low pressure. Blowers create differential pressure so they can be used to transport air or gas from one location to another. The discharge pressure of the blower needs to be higher than the system pressure if flow is to be established.
What is a blower performance curve?
The performance curve of PD blowers is a key tool for properly selecting a PD blower and estimating performance for PD blowers used in applications such as a new pneumatic conveying line or for troubleshooting an existing conveying line.
How do you use a blower performance curve?
PD blower manufacturers publish PD blower performance in various formats such as performance data tables (see Figure 1) and graphical representations (see Figure 2 & 3).
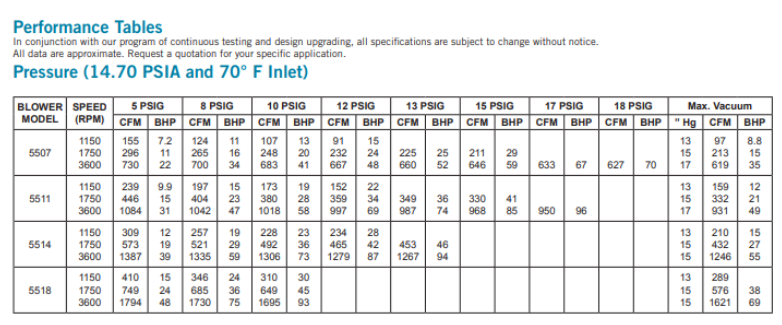
Figure 1: Sample MD-Kinney® 5500 PD Plus Blower Performance Table
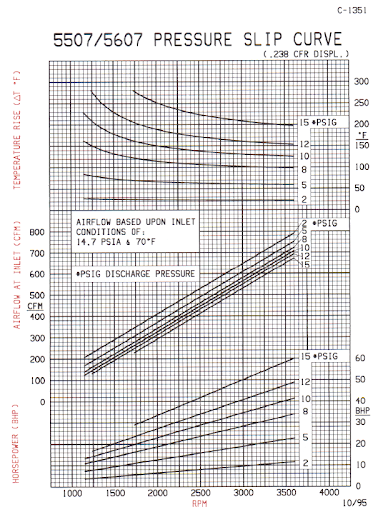
Figure 2: Sample MD-Kinney® 5507 PD Plus Blower Pressure Performance Curve
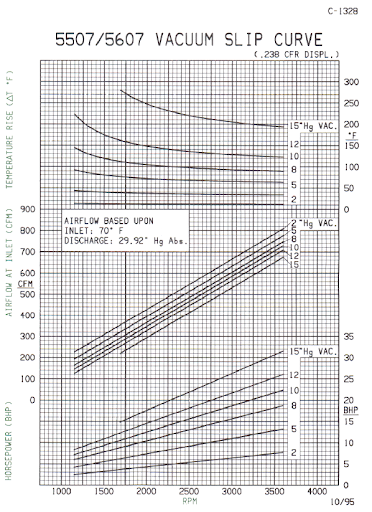
Figure 3: Sample MD-Kinney® 5507 PD Plus Blower Vacuum Performance Curve
A blower performance curve will plot the following data (US units):
- Air flow at the blower inlet (ICFM)
- Blower discharge pressure (PSIG)
- Blower speed (RPM)
- Braking horsepower required (BHP)
- Temperature rise over ambient conditions (deg F)
OEM published blower performance curves are based on a set of standard inlet conditions for both pressure and vacuum applications. For PD blower pressure applications, air flow will be based on inlet conditions of 14.7 PSIA pressure and 70°F temperature. For PD blower vacuum applications, air flow will be based on 29.92” Hg Abs discharge pressure and 70°F inlet temperature. PD Blower performance curves are different in pressure or vacuum applications so be sure to select the correct one.
Here is an example of how to read a blower performance curve:
Pneumatic conveying calculations are used to determine the required air flow rate for the specific conveying material and the expected pressure drop through the conveying line. For example, it has been determined that air flow rate of 260 ICFM and discharge pressure of 10 PSIG is needed. A blower is available and the engineer can check if the proposed blower can supply the air flow under this pressure drop. The engineer will check the operating point on the performance curve graph, determine the operating speed of the blower, the required power and temperature rise it will generate.
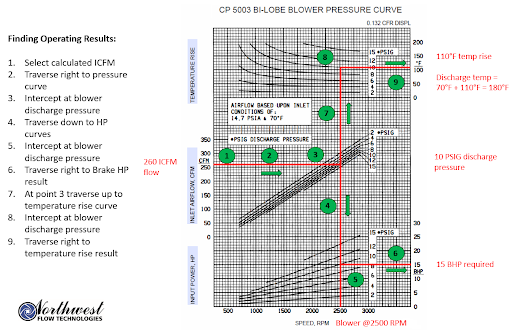
Figure 4: How To Read A PD Blower Performance Curve
For this example, the blower will run at 2500 RPM, will require 15 BHP and have a temperature rise of 110°F with a discharge temperature of 180 °F. This blower can run up to 15 PSIG and a higher speed so it has sufficient capacity for this application.